
Tag: Trading

  • Erova signs 15 year PPA with Clogheravaddy 2

    RESS 1 Wind Farm to Commence Operation under Erova PPA

    Dublin– 4th February 2022

    Erova Energy Ltd has entered into a 15-year Power Purchase Agreement with the Clogheravaddy 2 wind farm, a 10.8 MW project in Co. Donegal.

    The wind farm was successful in the country’s first RESS Auction. Under the agreement, Erova will manage the sale of the wind farm’s energy into the Irish Single Electricity Market on a 24-hour basis including all forecasting and balancing requirements. To secure the PPA Erova provide A Rated security.

    Michael Donnelly, Ireland Head of Origination, Erova Energy:
    “Erova is very proud to provide a route to market for the Clogheravaddy 2 wind farm, one of the first RESS 1 projects to connect to the grid and commence generation. Erova’s experience in trading the energy from government supported and merchant renewable projects in Ireland and abroad means that we are well placed to ensure Clogheravaddy 2 performs to the highest standard in the Irish market”.

    Erova will be providing the route to market for 14 projects who were successful in the RESS 1 auction, and it is keenly anticipating the upcoming RESS 2 auction where we will continue to offer the most competitive routes to market for any successful participants.


     -ENDS-


    About Erova Energy:

    Erova Energy is an energy trading company based in Dublin that commenced trading in the UK and Irish power markets in July 2015 and now has offices in Dublin, London and Amsterdam. Erova has unique expertise in short term traded markets with traded volumes in excess of 150 GWh/month across both proprietary and client-based positions. Erova services include interconnector trading, imbalance management, trading of renewable certificates, BESS trading, bespoke trading analytics, renewables forecasting and energy trading risk management solutions. We provide 24/7 shift trading with continuous market coverage 365 days a year. See http://erovaenergy.com/wp/


    Enquiries

    For all enquiries, please contact Michael Donnelly at michael.donnelly@erovaenery.ie 

  • I-SEM in Review: Week 36

    I-SEM in Review: Week 36

    Market Summary
    • Total Wind production was 1.54GW (All Ireland) on average throughout the week, 1% up from the previous week
    • Day Ahead price down 22% from the previous week (Average 37.66, Max 60.94 and Min 1.87)
    • NIV positive (short) for 200 times and negative (long) for 136 times
    • There are 12 negative SIPs throughout the week (Average 38.84, Max 367.69 and Min -25.85)
    • Average Gas price (NBP front month) down 15% from the previous week. Its Ave 22.16, Max 25.10 and Min 19.50
    Overview of Market Prices
    Unit
    Average
    Max
    Min
     Positive
    Negative
     Demand
    GWh 3.93 4.94 2.67
     Wind
    GWh 1.54 3.20 0.04
     NIV
    MWh 3.10 67.70 -47.45 200 136
     DA
    EUR/MWh 37.66 60.94 1.87 336
     GAS
    GBP/thp 22.16 25.10 19.50
     SIP
    EUR/MWh 38.84 367.69 -25.85 324 12


  • I-SEM in Review: Week 35

    I-SEM in Review: Week 35

    Market Summary
    • Wind production was up 14% against the previous week producing 1.5GW (All Ireland).
    • Day Ahead price up 6% from the previous week (Average 48.24, Max 120.00 and Min 0), with the first 3 days remaining high whilst second half dropped as participants saw high wind output.
    • NIV positive (short) for 179 times and negative (long) for 157 times.
    • Negative SIP accounted for 50 pricing event throughout the week. (Average 31.20, Max 312.83 and Min -221.26).
    • Average Gas price (NBP front month) dropped down 2.69% from the week 34. Its Ave 26.36, Max 27.75 and Min 25.25.
    Overview of Market Prices
    Unit
    Average
    Max
    Min
     Positive
    Negative
     Demand
    GWh 3.89 4.85 2.61
     Wind
    GWh 1.50 2.97 0.21
     NIV
    MWh -2.00 54.01 -82.84 179 157
     DA
    EUR/MWh 48.24 120.00 336
     GAS
    GBP/thp 26.36 27.75 25.25
     SIP
    EUR/MWh 31.20 312.83 -221.26 286 50
  • I-SEM in Review: Week 20

    Market Summary
    • Wind production returned this week, up 55% against the previous week with 1.08GW (All Ireland).
    • Day Ahead prices were down 12% from week 19. (Average 45.81, Max 71.19 and Min 29.12)
    • NIV positive (short) for 184 times and negative (long) for 152 times.
    • Negative SIP accounted for 20 pricing event throughout the week. (Average 44.88, Max 482.09 and Min -112.42).
    • Average Gas price (NBP front month) dropped down 6% from the week 19. Its Ave 30.90, Max 32.43 and Min 29.85.
    Overview of Market Prices
    Unit
    Average
    Max
    Min
     Positive
    Negative
     Demand
    GWh 3.93 4.80 2.65
     Wind
    GWh 1.08 2.60 0.21
     NIV
    MWh -0.78 48.86 -85.66 184 152
     DA
    EUR/MWh 45.81 71.19 29.12 336
     GAS
    GBP/thp 30.90 32.43 29.85
     SIP
    EUR/MWh 44.88 482.09 -112.42 318 18
  • I-SEM in Review: Week 19

    I-SEM in Review: Week 19

    Market Summary
    • Wind produced 0.70GW (All Ireland) on average throughout the week, 13% down from the week 18.
    • Day Ahead price up 5% from the week 18. (Average €51.82/MWh, Max €93.20/Mwh and Min €27.83/MWh)
    • NIV positive (short) for 226 times and negative (long) for 110 times.
    • Negative SIP accounted for 1 block throughout the week with an average price of €55.40/Mwh (Max €453.75/MWh and Min -€12.25/MWh).
    • Average Gas price (NBP front month) dropped down 2% from the week 18 with an average price of  33.00 p/th (Max 34.10p and Min 31.90p).


    Overview of Market Prices
    Unit
    Average
    Max
    Min
     Positive
    Negative
     Demand
    GWh 4.08 5.15 2.87
     Wind
    GWh 0.70 2.31 0.04
     NIV
    MWh 5.97 63.42 -46.55 226 110
     DA
    EUR/MWh 51.82 93.20 27.83 336
     GAS
    GBP/thp 33.00 34.10 31.90
     SIP
    EUR/MWh 55.40 453.75 -12.25 355 1


  • I-SEM in Review: Week 16

    Market Summary
    • On average wind produced 1.19GW across the week, 21% down from week 15.
    • Although wind output was down we didn’t see an uplift in power prices with the Day Ahead price down 9% from week 15. (Average €50.62/MWh, Max €79.01/MWh and Min -€0.10/MWh)
    • NIV positive (short) for 162 times and negative (long) for 174 times.
    • Negative SIP accounted for 7 periods throughout the week (Average €55.84/MWh, Max €367.26/MWh and Min -€144.38/MWh).
    • Average Gas price (NBP front month) gained 10% from week 15 (Average 35.25 p/th, Max 37.25 p/th and Min 34.45 p/th).


    Overview of Market Prices
    Unit
    Average
    Max
    Min
     Positive
    Negative
     Demand
    GWh 4.20 5.30 2.87
     Wind
    GWh 1.19 3.87 0.04
     NIV
    MWh -0.27 67.27 -57.77 162 174
     DA
    EUR/MWh 50.62 79.01 -0.10 332 4
     GAS
    GBP/thp 35.25 37.25 34.45
     SIP
    EUR/MWh 55.84 367.26 -144.38 329 7
  • I-SEM in Review: Week 15

    I-SEM in Review: Week 15


    Market Summary
    • Wind produced 1.50GW  on average throughout the week, 14% up from the week 14.
    • Day Ahead price was up 15% from the week 14 with an average price of €55.69/MWh(Max €109.89, Min €0)
    • NIV positive (short) for 193 times and negative (long) for 143 times.
    • SIP out tuned at €51.16/MWh (Max €218.42, Min -€203.57).
    • Average Gas price (NBP front month) gained a further 4% from the week 13, its avg 38.71 p/th (Max 41.55 p/th, Min 37.70 p/th).


    Overview of Market Prices
    Unit
    Average
    Max
    Min
     Positive
    Negative
     Demand
    GWh 4.28 5.14 3.00
     Wind
    GWh 1.50 3.37 0.17
     NIV
    MWh 2.41 75.20 -54.16 193 143
     DA
    EUR/MWh 55.69 109.89 336
     GAS
    GBP/thp 38.71 41.55 37.70
     SIP
    EUR/MWh 51.16 218.42 -203.57 315 21
  • I-SEM in Review: Week 14


    Market Summary
    • Wind production returned this week, up by 166% with an average output of 1.32GW.
    • Day Ahead power prices fell 12% from week 13 with an average price of €48.52/MWh (Max €45.80, Min €49.31).
    • NIV positive (short) for 205 times and negative (long) for 131 times.
    • System prices averaged out at €62.97/MWh (vs €59.56 in the previous week) with a spread of -€37.97 to €342.77.
    • Average Gas price (NBP front month) started to gain with a 4% increase from last week (Avg 37.17 p/th, Max 41.50 p/th, Min 32.13 p/th).


    Overview of Market Prices
    Unit
    Average
    Max
    Min
     Positive
    Negative
     Demand
    GWh 4.39 5.39 3.10
     Wind
    GWh 1.32 3.36 0.24
     NIV
    MWh 2.62 45.80 -49.31 205 131
     DA
    EUR/MWh 48.52 81.42 30.39 336
     GAS
    GBP/thp 37.17 41.50 32.13
     SIP
    EUR/MWh 62.97 342.77 -37.97 335 1
  • I-SEM in Review: Week 13


    Market Summary
    • A further fall in wind output last week, generating only 0.50GW on average throughout the week, 61% down from the week 12.
    • Day Ahead power price was up 11% (Average €55.04/MWh, Max €110.83/MWh and Min €32.77/MWh).
    • NIV positive (short) for 138 times and negative (long) for 198 times.
    • System price maintained at €59.56/MWh with only 5 period of negative pricing events (Max €244.52/MWh and Min -€118.65/MWh).
    • The fall in Gas price continued last week achieving an average of 35.80 p/th (NBP front month) (Max 37.15 p/th and Min 35.50 p/th.


    Overview of Market Prices
    Unit
    Average
    Max
    Min
     Positive
    Negative
     Demand
    GWh 4.30 5.29 3.05
     Wind
    GWh 0.50 1.25 0.09
     NIV
    MWh -2.46 46.97 -38.71 138 198
     DA
    EUR/MWh 55.04 110.83 32.77 334
     GAS
    GBP/thp 35.80 37.15 35.50
     SIP
    EUR/MWh 59.56 244.52 -118.65 329 5
  • I-SEM in Review: Week 12

    I-SEM in Review: Week 12


    Market Summary
    • As we approach the end of the winter season we see wind production fall this week to 1.28GW (on average throughout the week), half the output generated the previous week.
    • Day Ahead power ended up with an average of €49.43/MWh (increasing by 22% from week 11). The spread returned to levels seen in previous weeks with a high of €85.00/Mwh and a low of -€1.00/MWh.
    • NIV positive (short) for 169 times and negative (long) for 167 times.
    • System prices (SIP) was up considerably delivering an average price of  €60.93/MWh (double that of last week).
    • LNG prices in East Asia are now below NBP placing continued pressure on NBP, falling a further 5% at 36.89p (Max 37.80p and Min 36.30p).


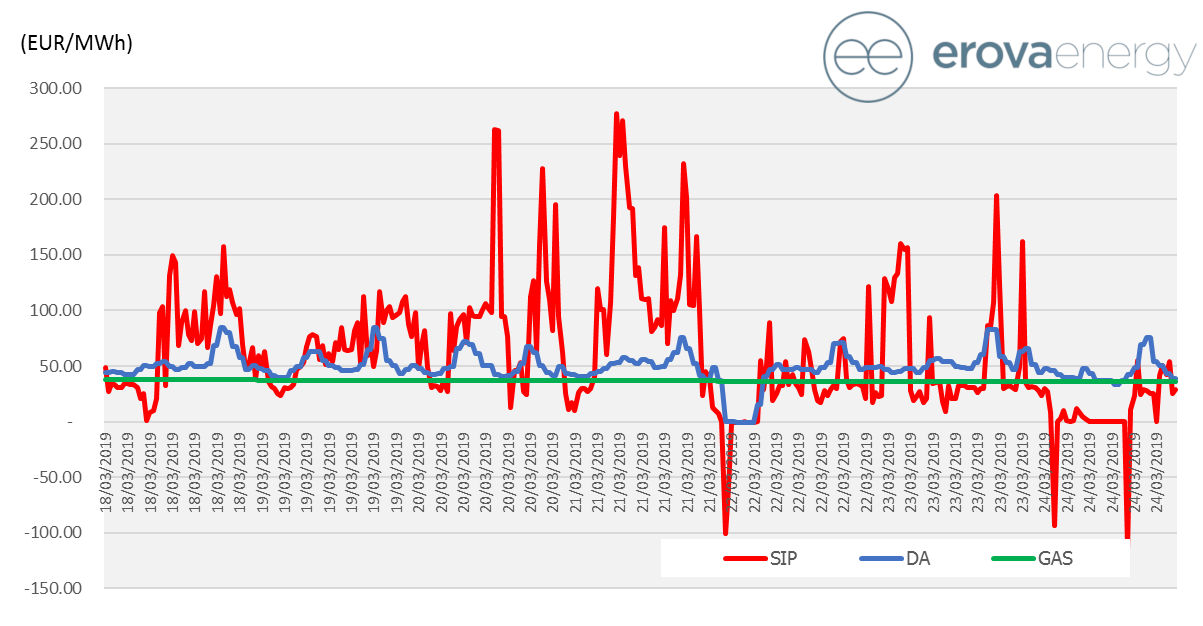
    Pricing Overview (DA vs SIP vs Gas)


    Overview of Market Prices
    Unit
    Average
    Max
    Min
     Positive
    Negative
     Demand
    GWh 4.31 5.58 3.03
     Wind
    GWh 1.28 2.88 0.08
     NIV
    MWh -3.79 69.97 77.36 169 167
     DA
    EUR/MWh 49.43 85.00 -1.00 330 6
     GAS
    GBP/thp 36.89 37.80 36.30
     SIP
    EUR/MWh 60.93 277.40 -113.28 322 14