Tag: Trading

  • I-SEM in Review – Week 11

    I-SEM in Review – Week 11


    Market Summary
    • Wind produced 2.68GW (All Ireland) on average throughout the week, 27% up from week 10.
    • Day Ahead power continued to fall a further 21% from the previous week achieving an average price of €40.66/MWh however the spread widened further with a high of €114.30 (vs €88.69/MWh week 10) and a low of  -€7.00 (vs €1.00/MWh week 10).
    • The system remained longer this week due to increased wind output with NIV positive (short) for 137 times and negative (long) for 199 times.
    • Negative SIP accounted for 28 pricing events throughout the week with an average price €30.93/MWh and a spread of  -€223.74/MWh to €187.88/MWh.
    •  Bearish sentiment continued throughout the week for gas with the average price (NBP front month) down 8% from week 10. (Avg 39.00p with a Max 41.55p and Min 37.60p).


    Overview of Market Prices
    Unit
    Average
    Max
    Min
     Positive
    Negative
     Demand
    GWh 4.49 5.79 3.17
     Wind
    GWh 2.68 3.76 0.52
     NIV
    MWh -8.16 47.37 -78.12 137 199
     DA
    EUR/MWh 40.66 114.30 -7.00 298 38
     GAS
    GBP/thp 39.00 41.55 37.60
     SIP
    EUR/MWh 30.93 187.88 -223.74 308 28
  • I-SEM in Review – Week 10

    I-SEM in Review – Week 10


    Market Summary
    • Wind produced 2.12GW (All Ireland) on average throughout the week, 65% up from the week 9.
    • Day Ahead fell back by 8% with an average price of €51.14/MWh (Max €88.69 and Min €1.00).
    • NIV positive (short) for 183 times and negative (long) for 153 times.
    • SIP spiked during high demand and as wind generation fell,  negative prices occurred for only 6  periods during the week (average €53.52/MWh, Max €236.66 and Min -€12.77).
    • Gas (NBP front month) was up 5% with an average price of  46.13p (Max 46.95p and Min 43.45p).


    Overview of Market Prices
    Unit
    Average
    Max
    Min
     Positive
    Negative
     Demand
    GWh 4.55 5.89 3.17
     Wind
    GWh 2.12 3.42 0.37
     NIV
    MWh 2.88 88.69 88.13 183 153
     DA
    EUR/MWh 51.24 155.00 1.00 336
     GAS
    GBP/thp 46.13 46.95 43.45
     SIP
    EUR/MWh 53.52 236.66 -12.77 330 6
  • I-SEM in Review – Week 9


    Market Summary
    • Wind production was down 50% against last week with an All Ireland output averaging  1.28GW.
    • Due to the lower output, Day Ahead power prices were up 18% achieving an average price of €55.56/MWh (Max €96.73 and Min €32.50)
    • NIV positive (short) for 183 times vs negative (long) for 153 times.
    • SIP remained volatile throughout the week with an average of €66.47/MWh (Max €464.75 and Min -€165.79).
    • Gas (NBP front month) continues to maintain a weak price with a further 2% drop against last week. (Ave 45.14, Max 45.90 and Min 43.90 ).


    Overview of Market Prices
    Unit
    Average
    Max
    Min
     Positive
    Negative
     Demand
    GWh 4.46 5.84 3.10
     Wind
    GWh 1.28 3.76 0.14
     NIV
    MWh 1.09 134.11 -60.77 183 153
     DA
    EUR/MWh 55.56 96.73

    32.50

    336
     GAS
    GBP/thp 45.14 45.90 43.90
     SIP
    EUR/MWh 66.47 464.75 – 165.79 316  20
  • I-SEM in Review – Week 8

    I-SEM in Review – Week 8


    Market Summary
    • Wind produced 2.58GW on average throughout the week, up 5% against the previous week.
    • Day Ahead prices softened with a 9% drop from the previous week. (Average €47.23, Max €106.53 and Min €0).
    • System prices remained volatile throughout the week although the spread reduced with an Average €34.78 (Max €222.73 and Min -€165.81).
    • Gas (NBP front month) continues to be in its bearish sentiment, pricing slightly lower (-2%) from the previous week


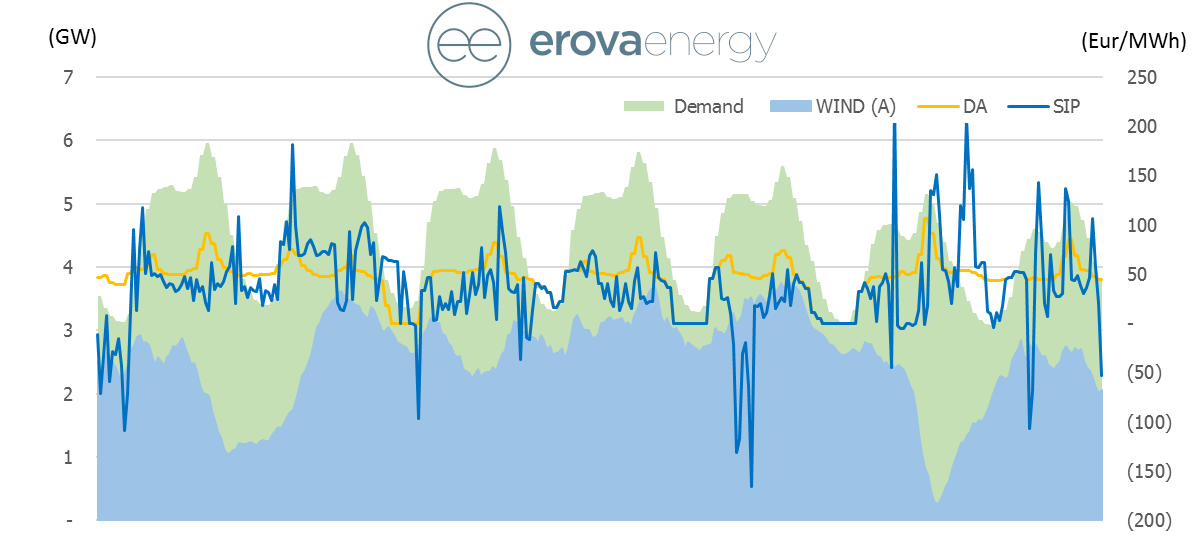
    Demand vs Wind Generation vs PriceISEM Week 8
    Unit
    Average
    Max
    Min
     Positive
    Negative
     Demand
    GWh 4.49 5.97 3.08
     Wind
    GWh 2.58 3.76 0.27
     NIV
    MWh – 8.96 37.12 – 89.08 150 186
     DA
    EUR/MWh 47.23 106.53

    336
     GAS
    GBP/thp 46.56 47.23 45.80
     SIP
    EUR/MWh 34.78 222.73 – 165.81 296  40
  • I-SEM in Review – Week 7

    February has brought some interesting prices and below is a quick overview of what we saw during Week 7 of 2019.

    Day ahead prices we suppressed due to an overall increase in wind generation compared to the previous weeks however this continued to maintain a volatile within-day market as seen by the the system price spread (high of €337.06/MWh and a low of -€195.60).

    Unit
    Average
    Max
    Min
    Count on Negative
    Count on Positive
    Demand
    GWh 4.50 6.05 3.03
    Wind
    GWh 2.47 3.40 0.18
    NIV
    MWh -7.26 48.04 – 67.22 184 152
    DA
    EUR/MWh 51.96 141.48 – 10.29 20 316
    SIP
    EUR/MWh 25.71 337.06 – 195.60 55 281
  • I-SEM – How high can prices go?

    I-SEM – How high can prices go?

    On the 24th January 2019 we saw I-SEM prices reach €3,773.69/MWh, the largest spike in the electricity price that I-SEM has seen since going live in October last year. Kim Scullion from our Origination team provides a short overview of the market drivers for this unusual price event.

     
    Reason
    What happened?
    1.
    Gas Plant offline
    On the 24th January the System Operator in Northern Ireland issued an Amber Alert. An Amber Alert indicates that the Margin (the difference between demand and generation) is extremely tight. One reason for this was that a large gas plant in Northern Ireland was offline.
    2.
    Low Wind in Northern Ireland
    At the same time there was very low levels of wind generation in Northern Ireland (approx. 11MW).
    3.
    High Wind in Republic of Ireland
    Unusually, at the same time there was low winds in Northern Ireland, there was very high levels of wind generation in the Republic of Ireland (approx. 2,400MW).
    4.
    North South Interconnector full
    The North South Interconnector was full, exporting from the Republic of Ireland to Northern Ireland. Therefore, no plants in the Republic of Ireland could set the price for meeting the demand in Northern Ireland and subsequently the demand in I-SEM.
    5.
    Moyle Interconnector exporting
    The Moyle Interconnector is scheduled before real time (day ahead) and was therefore exporting power from Northern Ireland to Great Britain, which had higher prices at the Day Ahead stage.
    6.
    High price for “constrained on” generation
    So, although generators in the Republic of Ireland were offering relatively low prices to generate into the I-SEM market the System Operator was forced to call on plant in Northern Ireland that had offered to generate at very high prices in order to meet demand in Northern Ireland and ultimately the demand in ISEM.
    7.
    High Imbalance Price
    The Imbalance Price for the half hour 1pm to 1.30pm was set at €3,773.69/MWh, the highest Imbalance price seen in the I-SEM to date.

    We have issued a market update directly to any of our counterparts under contract with us but if you require further information please contact one of the Origination team.

  • Day 1: I-SEM goes live

    Day 1: I-SEM goes live

    The I-SEM successfully launched yesterday with the first day-ahead hourly auction and intra-day auction. Day-ahead prices out-turned at a baseload price of €82/MWh, this appeared relatively high considering a day-ahead wind forecast of greater than 2GW for the evening peak  (for comparison the last week of available SEM prices with similar availability profile and less wind generation had a baseload average of €73/MWh).

    The main driver of prices relate to recent forced outages of the three Moneypoint units and a Kilroot unit (~1 GW of in-merit coal generation) and a scheduled outage at Great Island CCGT (400 MW). The equivalent GB baseload price was €75/MWh resulting in a predominant import flow on both EWIC and Moyle interconnectors, both interconnectors flipped to export for the evening peak corresponding with a high wind penetration in I-SEM.
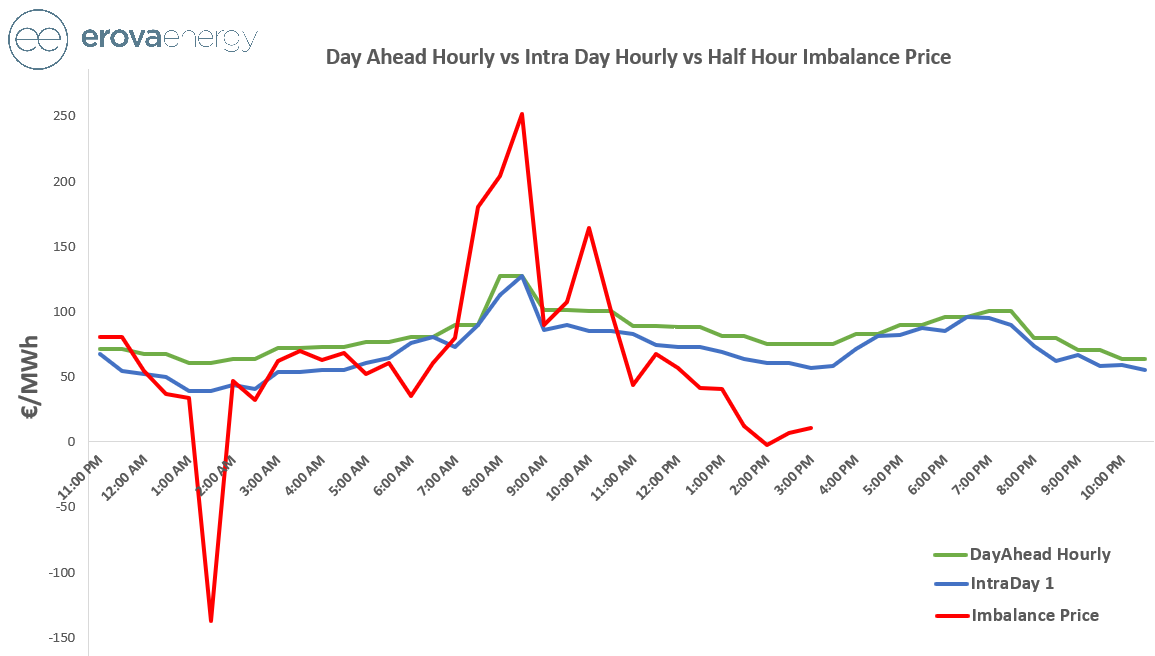
    In terms of liquidity, 75 GWhs traded in day-ahead hourly auction with 10% of this volume traded in the first intra-day auction. Interestingly, the baseload price fell from €82/MWh to €70/MWh between auctions, perhaps related to thinner volumes in the intra-day auction. The intra-day 2 auction (11AM – 11PM) showed a further decline in prices by €3 for the equivalent periods to intra-day 1. Liquidity fears in for the continuous M7 market have been realised with very thin volumes traded across the day (low double digit volumes MW traded in each half hour), these sub-optimal liquidity conditions place increasing pressure on the participants to be balanced after the intra-day auctions.

    The balancing market has proved incredibly volatile with 5 minute imbalance prices ranging from -€1,000/MWh (yes minus one thousand euro!) at 01.55 to +€381/MWh at 08.55 this morning. As anticipated, the wind delta versus forecasted wind is the main factor impacting the long / short direction of the market. Bizarrely, the -€1000/MWh price actually occurred during a short imbalance period.  As is evident from the graph above, wind over-delivering versus forecast results in a very long market across the afternoon and was reflected in the imbalance price.

    Whilst all of this was taking place, Erova announced it’s first Imbalance Management agreement with Greencoat (click here). We provide forcasting and balancing management with I-SEM, removing the exposure to such prices as seen today. To find out further details please contact our Origination Team (contact us).