Category: Insights

  • I-SEM in Review: Week 13


    Market Summary
    • A further fall in wind output last week, generating only 0.50GW on average throughout the week, 61% down from the week 12.
    • Day Ahead power price was up 11% (Average €55.04/MWh, Max €110.83/MWh and Min €32.77/MWh).
    • NIV positive (short) for 138 times and negative (long) for 198 times.
    • System price maintained at €59.56/MWh with only 5 period of negative pricing events (Max €244.52/MWh and Min -€118.65/MWh).
    • The fall in Gas price continued last week achieving an average of 35.80 p/th (NBP front month) (Max 37.15 p/th and Min 35.50 p/th.


    Overview of Market Prices
    Unit
    Average
    Max
    Min
     Positive
    Negative
     Demand
    GWh 4.30 5.29 3.05
     Wind
    GWh 0.50 1.25 0.09
     NIV
    MWh -2.46 46.97 -38.71 138 198
     DA
    EUR/MWh 55.04 110.83 32.77 334 –
     GAS
    GBP/thp 35.80 37.15 35.50
     SIP
    EUR/MWh 59.56 244.52 -118.65 329 5
  • I-SEM in Review: Week 12

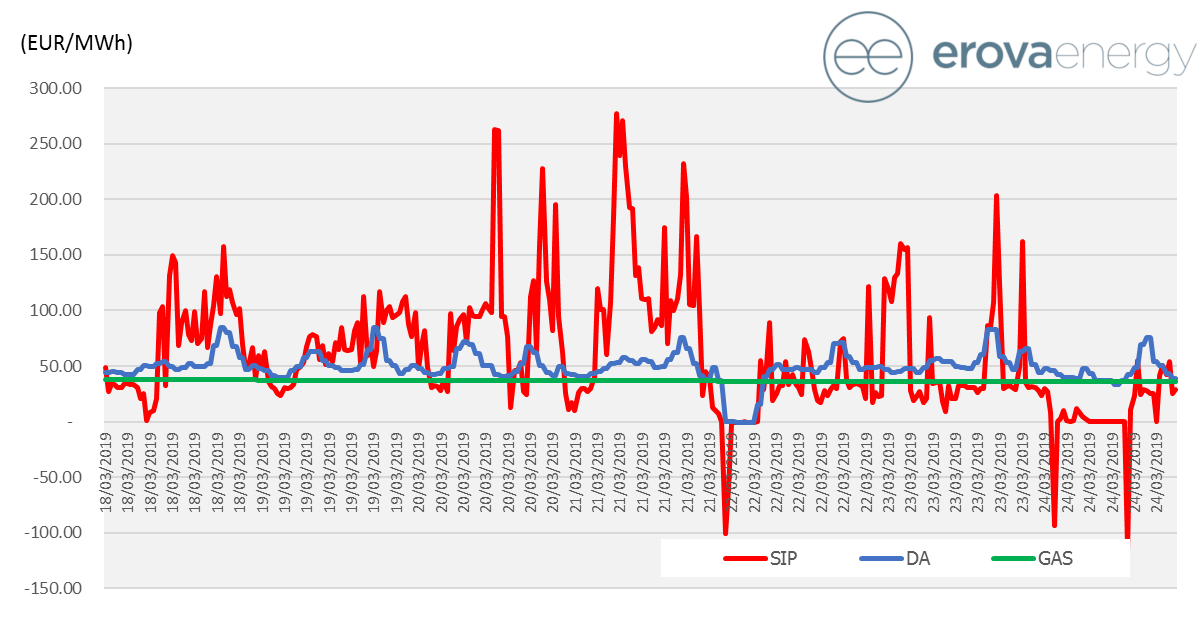
    I-SEM in Review: Week 12


    Market Summary
    • As we approach the end of the winter season we see wind production fall this week to 1.28GW (on average throughout the week), half the output generated the previous week.
    • Day Ahead power ended up with an average of €49.43/MWh (increasing by 22% from week 11). The spread returned to levels seen in previous weeks with a high of €85.00/Mwh and a low of -€1.00/MWh.
    • NIV positive (short) for 169 times and negative (long) for 167 times.
    • System prices (SIP) was up considerably delivering an average price of  €60.93/MWh (double that of last week).
    • LNG prices in East Asia are now below NBP placing continued pressure on NBP, falling a further 5% at 36.89p (Max 37.80p and Min 36.30p).


    Pricing Overview (DA vs SIP vs Gas)


    Overview of Market Prices
    Unit
    Average
    Max
    Min
     Positive
    Negative
     Demand
    GWh 4.31 5.58 3.03
     Wind
    GWh 1.28 2.88 0.08
     NIV
    MWh -3.79 69.97 77.36 169 167
     DA
    EUR/MWh 49.43 85.00 -1.00 330 6
     GAS
    GBP/thp 36.89 37.80 36.30
     SIP
    EUR/MWh 60.93 277.40 -113.28 322 14
  • I-SEM in Review – Week 11

    I-SEM in Review – Week 11


    Market Summary
    • Wind produced 2.68GW (All Ireland) on average throughout the week, 27% up from week 10.
    • Day Ahead power continued to fall a further 21% from the previous week achieving an average price of €40.66/MWh however the spread widened further with a high of €114.30 (vs €88.69/MWh week 10) and a low of  -€7.00 (vs €1.00/MWh week 10).
    • The system remained longer this week due to increased wind output with NIV positive (short) for 137 times and negative (long) for 199 times.
    • Negative SIP accounted for 28 pricing events throughout the week with an average price €30.93/MWh and a spread of  -€223.74/MWh to €187.88/MWh.
    •  Bearish sentiment continued throughout the week for gas with the average price (NBP front month) down 8% from week 10. (Avg 39.00p with a Max 41.55p and Min 37.60p).


    Overview of Market Prices
    Unit
    Average
    Max
    Min
     Positive
    Negative
     Demand
    GWh 4.49 5.79 3.17
     Wind
    GWh 2.68 3.76 0.52
     NIV
    MWh -8.16 47.37 -78.12 137 199
     DA
    EUR/MWh 40.66 114.30 -7.00 298 38
     GAS
    GBP/thp 39.00 41.55 37.60
     SIP
    EUR/MWh 30.93 187.88 -223.74 308 28
  • I-SEM in Review – Week 10

    I-SEM in Review – Week 10


    Market Summary
    • Wind produced 2.12GW (All Ireland) on average throughout the week, 65% up from the week 9.
    • Day Ahead fell back by 8% with an average price of €51.14/MWh (Max €88.69 and Min €1.00).
    • NIV positive (short) for 183 times and negative (long) for 153 times.
    • SIP spiked during high demand and as wind generation fell,  negative prices occurred for only 6  periods during the week (average €53.52/MWh, Max €236.66 and Min -€12.77).
    • Gas (NBP front month) was up 5% with an average price of  46.13p (Max 46.95p and Min 43.45p).


    Overview of Market Prices
    Unit
    Average
    Max
    Min
     Positive
    Negative
     Demand
    GWh 4.55 5.89 3.17
     Wind
    GWh 2.12 3.42 0.37
     NIV
    MWh 2.88 88.69 88.13 183 153
     DA
    EUR/MWh 51.24 155.00 1.00 336 –
     GAS
    GBP/thp 46.13 46.95 43.45
     SIP
    EUR/MWh 53.52 236.66 -12.77 330 6
  • I-SEM in Review – Week 9


    Market Summary
    • Wind production was down 50% against last week with an All Ireland output averaging  1.28GW.
    • Due to the lower output, Day Ahead power prices were up 18% achieving an average price of €55.56/MWh (Max €96.73 and Min €32.50)
    • NIV positive (short) for 183 times vs negative (long) for 153 times.
    • SIP remained volatile throughout the week with an average of €66.47/MWh (Max €464.75 and Min -€165.79).
    • Gas (NBP front month) continues to maintain a weak price with a further 2% drop against last week. (Ave 45.14, Max 45.90 and Min 43.90 ).


    Overview of Market Prices
    Unit
    Average
    Max
    Min
     Positive
    Negative
     Demand
    GWh 4.46 5.84 3.10
     Wind
    GWh 1.28 3.76 0.14
     NIV
    MWh 1.09 134.11 -60.77 183 153
     DA
    EUR/MWh 55.56 96.73

    32.50

    336 –
     GAS
    GBP/thp 45.14 45.90 43.90
     SIP
    EUR/MWh 66.47 464.75 – 165.79 316  20
  • I-SEM – How high can prices go?

    I-SEM – How high can prices go?

    On the 24th January 2019 we saw I-SEM prices reach €3,773.69/MWh, the largest spike in the electricity price that I-SEM has seen since going live in October last year. Kim Scullion from our Origination team provides a short overview of the market drivers for this unusual price event.

     
    Reason
    What happened?
    1.
    Gas Plant offline
    On the 24th January the System Operator in Northern Ireland issued an Amber Alert. An Amber Alert indicates that the Margin (the difference between demand and generation) is extremely tight. One reason for this was that a large gas plant in Northern Ireland was offline.
    2.
    Low Wind in Northern Ireland
    At the same time there was very low levels of wind generation in Northern Ireland (approx. 11MW).
    3.
    High Wind in Republic of Ireland
    Unusually, at the same time there was low winds in Northern Ireland, there was very high levels of wind generation in the Republic of Ireland (approx. 2,400MW).
    4.
    North South Interconnector full
    The North South Interconnector was full, exporting from the Republic of Ireland to Northern Ireland. Therefore, no plants in the Republic of Ireland could set the price for meeting the demand in Northern Ireland and subsequently the demand in I-SEM.
    5.
    Moyle Interconnector exporting
    The Moyle Interconnector is scheduled before real time (day ahead) and was therefore exporting power from Northern Ireland to Great Britain, which had higher prices at the Day Ahead stage.
    6.
    High price for “constrained on” generation
    So, although generators in the Republic of Ireland were offering relatively low prices to generate into the I-SEM market the System Operator was forced to call on plant in Northern Ireland that had offered to generate at very high prices in order to meet demand in Northern Ireland and ultimately the demand in ISEM.
    7.
    High Imbalance Price
    The Imbalance Price for the half hour 1pm to 1.30pm was set at €3,773.69/MWh, the highest Imbalance price seen in the I-SEM to date.

    We have issued a market update directly to any of our counterparts under contract with us but if you require further information please contact one of the Origination team.