Tag: I-SEM

  • I-SEM in Review – Week 10

    I-SEM in Review – Week 10


    Market Summary
    • Wind produced 2.12GW (All Ireland) on average throughout the week, 65% up from the week 9.
    • Day Ahead fell back by 8% with an average price of €51.14/MWh (Max €88.69 and Min €1.00).
    • NIV positive (short) for 183 times and negative (long) for 153 times.
    • SIP spiked during high demand and as wind generation fell,  negative prices occurred for only 6  periods during the week (average €53.52/MWh, Max €236.66 and Min -€12.77).
    • Gas (NBP front month) was up 5% with an average price of  46.13p (Max 46.95p and Min 43.45p).


    Overview of Market Prices
    Unit
    Average
    Max
    Min
     Positive
    Negative
     Demand
    GWh 4.55 5.89 3.17
     Wind
    GWh 2.12 3.42 0.37
     NIV
    MWh 2.88 88.69 88.13 183 153
     DA
    EUR/MWh 51.24 155.00 1.00 336
     GAS
    GBP/thp 46.13 46.95 43.45
     SIP
    EUR/MWh 53.52 236.66 -12.77 330 6
  • I-SEM in Review – Week 9


    Market Summary
    • Wind production was down 50% against last week with an All Ireland output averaging  1.28GW.
    • Due to the lower output, Day Ahead power prices were up 18% achieving an average price of €55.56/MWh (Max €96.73 and Min €32.50)
    • NIV positive (short) for 183 times vs negative (long) for 153 times.
    • SIP remained volatile throughout the week with an average of €66.47/MWh (Max €464.75 and Min -€165.79).
    • Gas (NBP front month) continues to maintain a weak price with a further 2% drop against last week. (Ave 45.14, Max 45.90 and Min 43.90 ).


    Overview of Market Prices
    Unit
    Average
    Max
    Min
     Positive
    Negative
     Demand
    GWh 4.46 5.84 3.10
     Wind
    GWh 1.28 3.76 0.14
     NIV
    MWh 1.09 134.11 -60.77 183 153
     DA
    EUR/MWh 55.56 96.73

    32.50

    336
     GAS
    GBP/thp 45.14 45.90 43.90
     SIP
    EUR/MWh 66.47 464.75 – 165.79 316  20
  • I-SEM in Review – Week 8

    I-SEM in Review – Week 8


    Market Summary
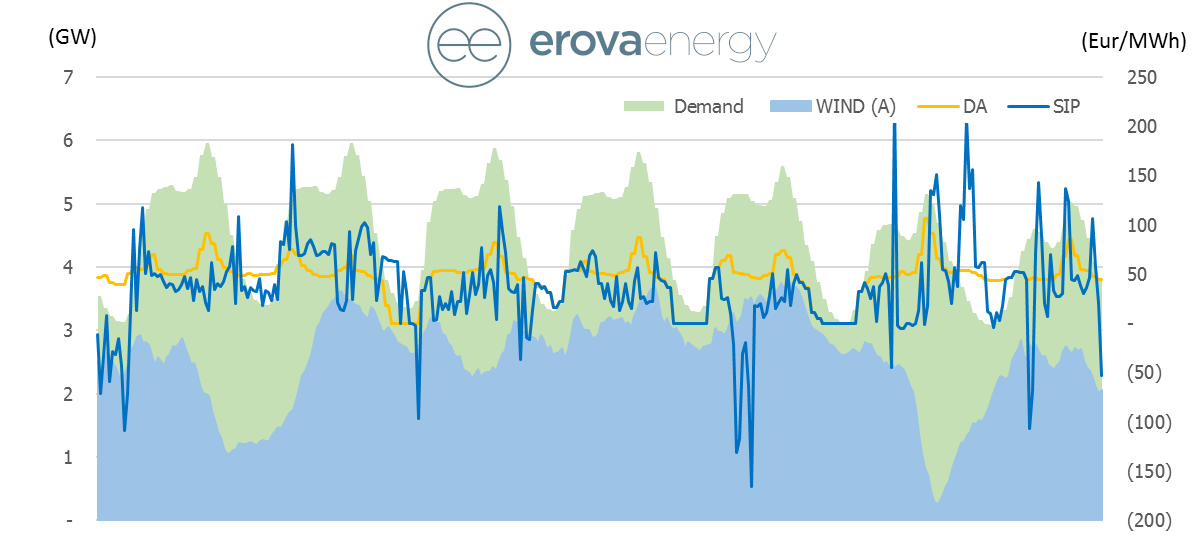
    • Wind produced 2.58GW on average throughout the week, up 5% against the previous week.
    • Day Ahead prices softened with a 9% drop from the previous week. (Average €47.23, Max €106.53 and Min €0).
    • System prices remained volatile throughout the week although the spread reduced with an Average €34.78 (Max €222.73 and Min -€165.81).
    • Gas (NBP front month) continues to be in its bearish sentiment, pricing slightly lower (-2%) from the previous week


    Demand vs Wind Generation vs PriceISEM Week 8
    Unit
    Average
    Max
    Min
     Positive
    Negative
     Demand
    GWh 4.49 5.97 3.08
     Wind
    GWh 2.58 3.76 0.27
     NIV
    MWh – 8.96 37.12 – 89.08 150 186
     DA
    EUR/MWh 47.23 106.53

    336
     GAS
    GBP/thp 46.56 47.23 45.80
     SIP
    EUR/MWh 34.78 222.73 – 165.81 296  40
  • I-SEM in Review – Week 7

    February has brought some interesting prices and below is a quick overview of what we saw during Week 7 of 2019.

    Day ahead prices we suppressed due to an overall increase in wind generation compared to the previous weeks however this continued to maintain a volatile within-day market as seen by the the system price spread (high of €337.06/MWh and a low of -€195.60).

    Unit
    Average
    Max
    Min
    Count on Negative
    Count on Positive
    Demand
    GWh 4.50 6.05 3.03
    Wind
    GWh 2.47 3.40 0.18
    NIV
    MWh -7.26 48.04 – 67.22 184 152
    DA
    EUR/MWh 51.96 141.48 – 10.29 20 316
    SIP
    EUR/MWh 25.71 337.06 – 195.60 55 281
  • I-SEM – How high can prices go?

    I-SEM – How high can prices go?

    On the 24th January 2019 we saw I-SEM prices reach €3,773.69/MWh, the largest spike in the electricity price that I-SEM has seen since going live in October last year. Kim Scullion from our Origination team provides a short overview of the market drivers for this unusual price event.

     
    Reason
    What happened?
    1.
    Gas Plant offline
    On the 24th January the System Operator in Northern Ireland issued an Amber Alert. An Amber Alert indicates that the Margin (the difference between demand and generation) is extremely tight. One reason for this was that a large gas plant in Northern Ireland was offline.
    2.
    Low Wind in Northern Ireland
    At the same time there was very low levels of wind generation in Northern Ireland (approx. 11MW).
    3.
    High Wind in Republic of Ireland
    Unusually, at the same time there was low winds in Northern Ireland, there was very high levels of wind generation in the Republic of Ireland (approx. 2,400MW).
    4.
    North South Interconnector full
    The North South Interconnector was full, exporting from the Republic of Ireland to Northern Ireland. Therefore, no plants in the Republic of Ireland could set the price for meeting the demand in Northern Ireland and subsequently the demand in I-SEM.
    5.
    Moyle Interconnector exporting
    The Moyle Interconnector is scheduled before real time (day ahead) and was therefore exporting power from Northern Ireland to Great Britain, which had higher prices at the Day Ahead stage.
    6.
    High price for “constrained on” generation
    So, although generators in the Republic of Ireland were offering relatively low prices to generate into the I-SEM market the System Operator was forced to call on plant in Northern Ireland that had offered to generate at very high prices in order to meet demand in Northern Ireland and ultimately the demand in ISEM.
    7.
    High Imbalance Price
    The Imbalance Price for the half hour 1pm to 1.30pm was set at €3,773.69/MWh, the highest Imbalance price seen in the I-SEM to date.

    We have issued a market update directly to any of our counterparts under contract with us but if you require further information please contact one of the Origination team.

  • Week 1: I-SEM and the Wind factor

    Week 1: I-SEM and the Wind factor

    After a week of the new I-SEM market, it has provided quite the roller coaster ride for market participants.

    Those suppliers and generators with an increased appetite to risk management and hedging will have been exposed to the extremely volatile (and at times, unpredictable) nature of the balancing market. In general, as mentioned in a our previous post, the wind imbalance is the primary driver of the market imbalance. Given the lack of liquidity in the intra-day auctions and in particular in the continuous market it places increased pressure on wind forecasting accuracy. See below an extreme example of forecast error from October 1, comparing the actual wind with day-ahead Eirgrid forecast there was an 89% forecast error.
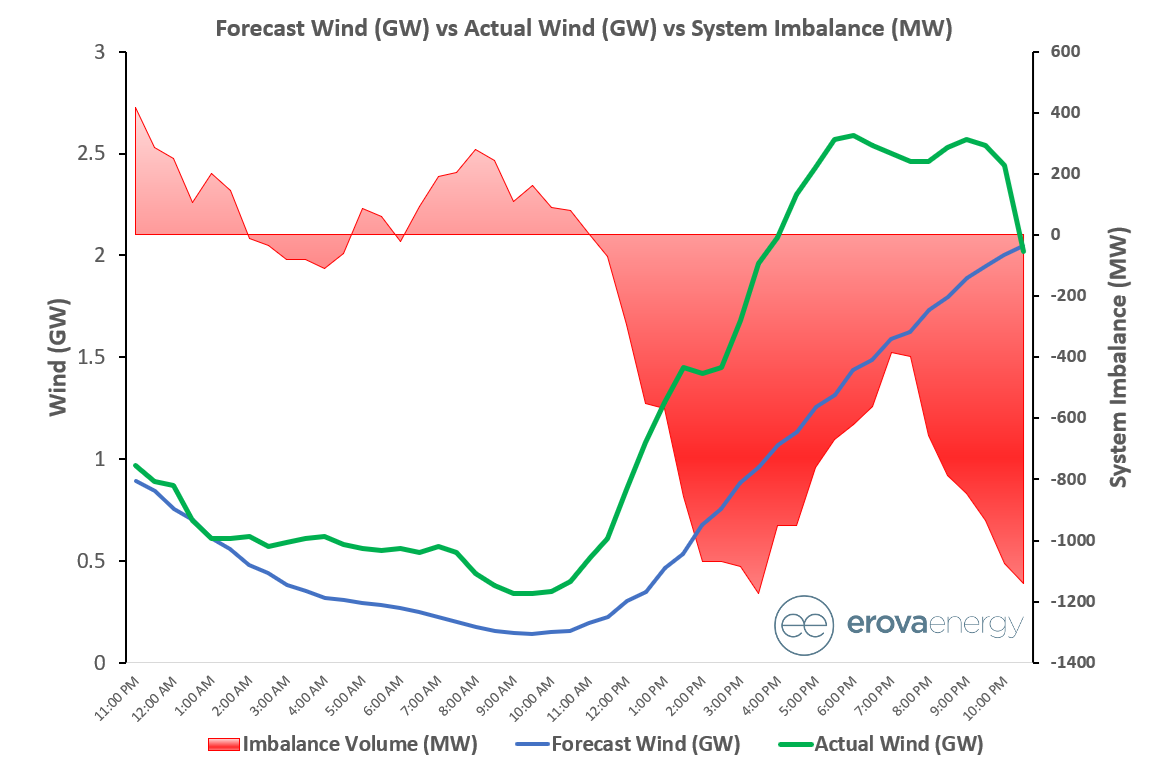
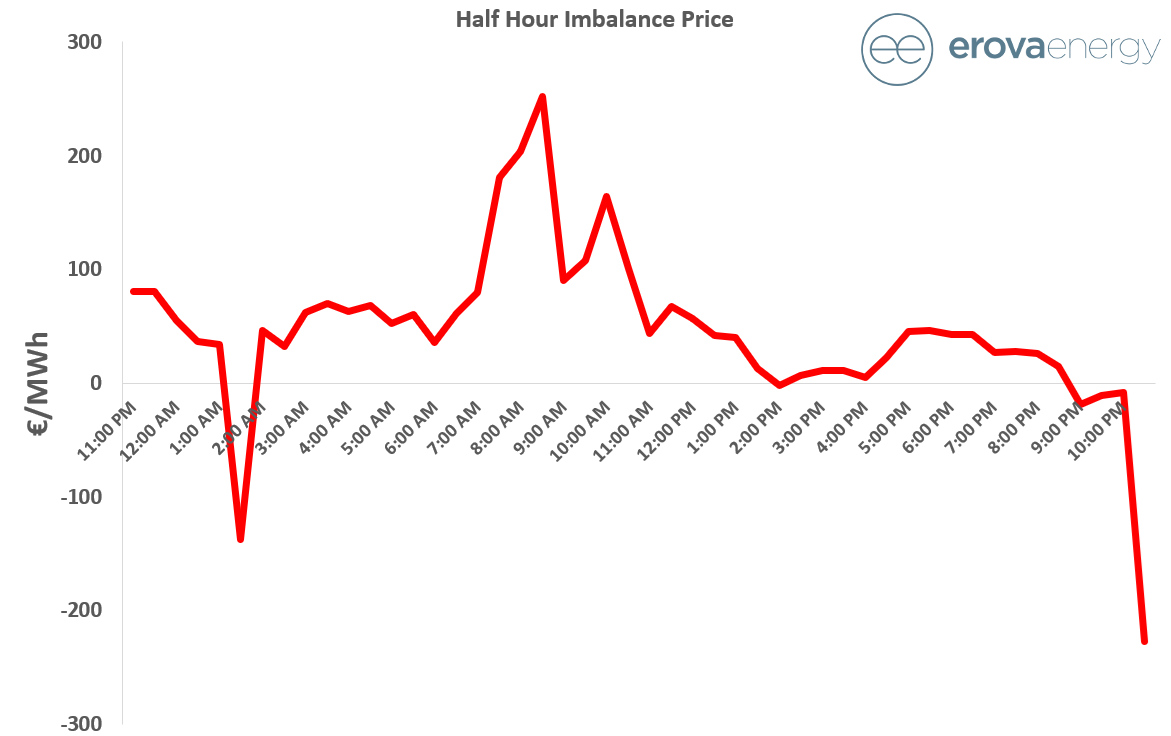
    As is evident from the graph, this dispersion sent the system over 1 GW long at periods across Monday evening which explains the below imbalance prices, (an imbalance price of -€226/MWh was recorded at 22.30). This would have proven a taxing evening for Eirgrid / SONI but at least helped un-hedged and even under-hedged suppliers who have been struggling with almost constant commodity price increases.
    Liquidity on the continuous market has improved across the week, (on average across the first two days there was an average of only 36MW traded in each half hour on M7 with trading activity in only 79 of 96 trading periods),  but still the wind error exceeds the cumulative volumes traded on the intra-day auctions and continuous market which has increased wind generators exposure to the balancing mechanism. In more established markets there is a strong correlation between the imbalance volume and the imbalance price, thus far in the I-SEM balancing market this relationship has proven relatively weak. Numerous negative prices have even been observed, counter intuitively, during periods of a short market which has been primarily associated with the commercial offer data of certain demand side units. Given the risk averse nature of your average utility, these various inconsistencies of the BM are energising market participants with one market participant comparing the imbalance price calculation to a ‘random number generator’. The ‘flagging and tagging’ process by the TSO is provoking debate, on Wednesday evening there were both system and energy acceptances from the same unit at almost €1,000/MWh in consecutive periods. The interconnectors were not fully importing across this tightness as the last scheduling opportunity was the second intra-day auction at 08.00 that morning, again Friday evening volatility and tightness was primarily wind related.

    Later in the week, the market was beginning to behave in a relatively more stable manner (5 minute imbalance prices still ranged from €100/MWh to €231/MWh across October 4th) with less volatility in wind and enhanced liquidity in the continuous market. The price spread between I-SEM and GB in the day ahead is quite narrow with on-going I-SEM outages maintaining prices slightly above GB.

    The weekend was set to be an interesting one with wind volume forecast to peak Sunday afternoon/evening close to 3GW in I-SEM. We’ll provide a further updates over the coming weeks on how this played out and any further developments that emerge as the market settles in.

    In the meantime, as with the GB electricity market, wind generators can remove their exposure from the imbalance price and align their electricity payments to the REFIT reference price, continuing to receive the maximum REFIT top-up payments. Please contact our team to discuss our Imbalance Management services which we provide across a number of contract structures.