Category: Insights

  • Renewables Portfolio 2022

    Renewables Portfolio 2022

    Supporting the Path to Net Zero

    Nick Williams, July 2022


    Continued Growth

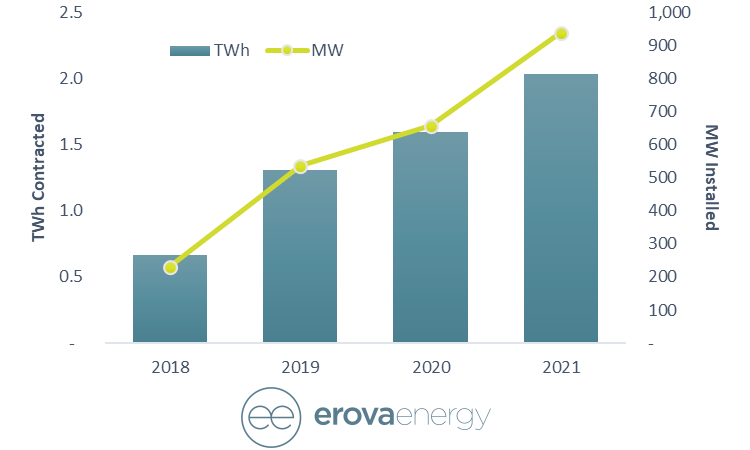
    Since inception, Erova have always looked at ways to maximise trading value, reduce risk and bring more renewables to the market. Since taking on our first renewable portfolio back in 2018 we have grown from zero MWs under managements to over 800MW with an additional 100MW in flexible generation. We aim to reach over 1GW of renewables by the end of this year with at least 20% of the portfolio coming from subsidy free assets.

    Core Markets

    Although Erova trade in 5 core markets (Ireland, UK, Netherlands, France and Germany) and as we currently look to enter new markets, more on that soon, we really focus our asset backed trading services in Ireland and the UK.

    In Ireland, our home ground, we have seen continued interest in our balancing service contracts. Providing a match against the REFIT market reference price and soon to be RESS market reference price.

    For the UK, we have continued to develop our PPA structures and continue to provide fully tailored Route-to-Market access for both renewable and flexible generation. Unlike the Irish market which continues to develop a large number of subsidy back products, the UK is moving forward with a subsidy free portfolio of projects and Erova are working with developers to maximise the value of these merchant assets especially with additional revenue streams such as the Balancing Market.


    Subsidy Free Power Purchase Agreements

    At present, ~200MW of Erova’s PPAs are from subsidy free assets which are either fully merchant or backed by a corporate PPA. We provide low cost balancing services on a long tenor, up to 15 years. This means our generators are certain of their take home price £/MWh as their balancing is fixed alongside their corporate PPA price.

    For fully merchant assets, Erova have developed their Balancing Mechanism access to allow for both large grid scale assets as well as small embedded assets to actively participate. Our AI driven price forecasts and dynamic pricing models allow for Erova to pro-actively monitor and manage the assets participation whilst remaining within the bid constraints set out in legislation (such as the TCLC).


    Bankability

    One of the key differentiators the large utilities bring to the market is their credit rating and ability to be a bankable offtaker. Over the past 3 years Erova have worked to generate a balance sheet capable of standing firm when reviewed by some of the leading project finance banks.

    More recently we’ve received an independent rating from Dun & Bradstreet of 3A, presenting the low risk nature of Erova as a counterparty.

  • Battery Optimisation

    The Process of Delivering Value

    Xie Zhang, November 2021


    The UK needs new flexibility and fast

    From 1st October 2024, Great Britain will no longer use coal to generate electricity. The energy deficit caused by the closure of coal, nuclear and gas plants can be addressed by the development of new renewable capacity. However, wind and solar power is not enough to handle the rapidly increasing flexibility deficit. This is where batteries are set to play an important role.


    Battery storage vs traditional thermal plant

    Battery storage offers unique benefits as batteries can respond extremely quickly and accurately in either direction (import or export). The National Grid ESO Control Room takes advantage of this quality and frequently uses batteries to deliver short bursts of power, typically under a 10-minute duration. This is ideal for balancing intraday swings in wind, solar and customer demand. Traditional thermal providers, including the newer, more flexible gas peaking plants, cannot do this, because of their ramp rate and minimum off times.

    Battery storage, however, has a limited lifespan before it needs to be recharged. Unlike a gas power station that could increase its power indefinitely, once the battery has discharged completely, it cannot sell any more energy. This must be recharged, either through trading or by waiting to be dispatched in the other direction.

    The good news is that 2-hour batteries are now available on the market, and our own analysis at Erova shows that the sweet spot is between 1 and 2 hours for maximum value generation.


    How does a battery make money?

    Short answer is to stack the revenues across different markets, namely Dynamic Containment and the Balancing Mechanism.

    Here is how Erova can help you get the most out of these two markets.


    Batteries in the balancing market

    The ESO Control Room makes sure that Great Britain has the essential energy it needs by making sure supply meets demand every second of every day.

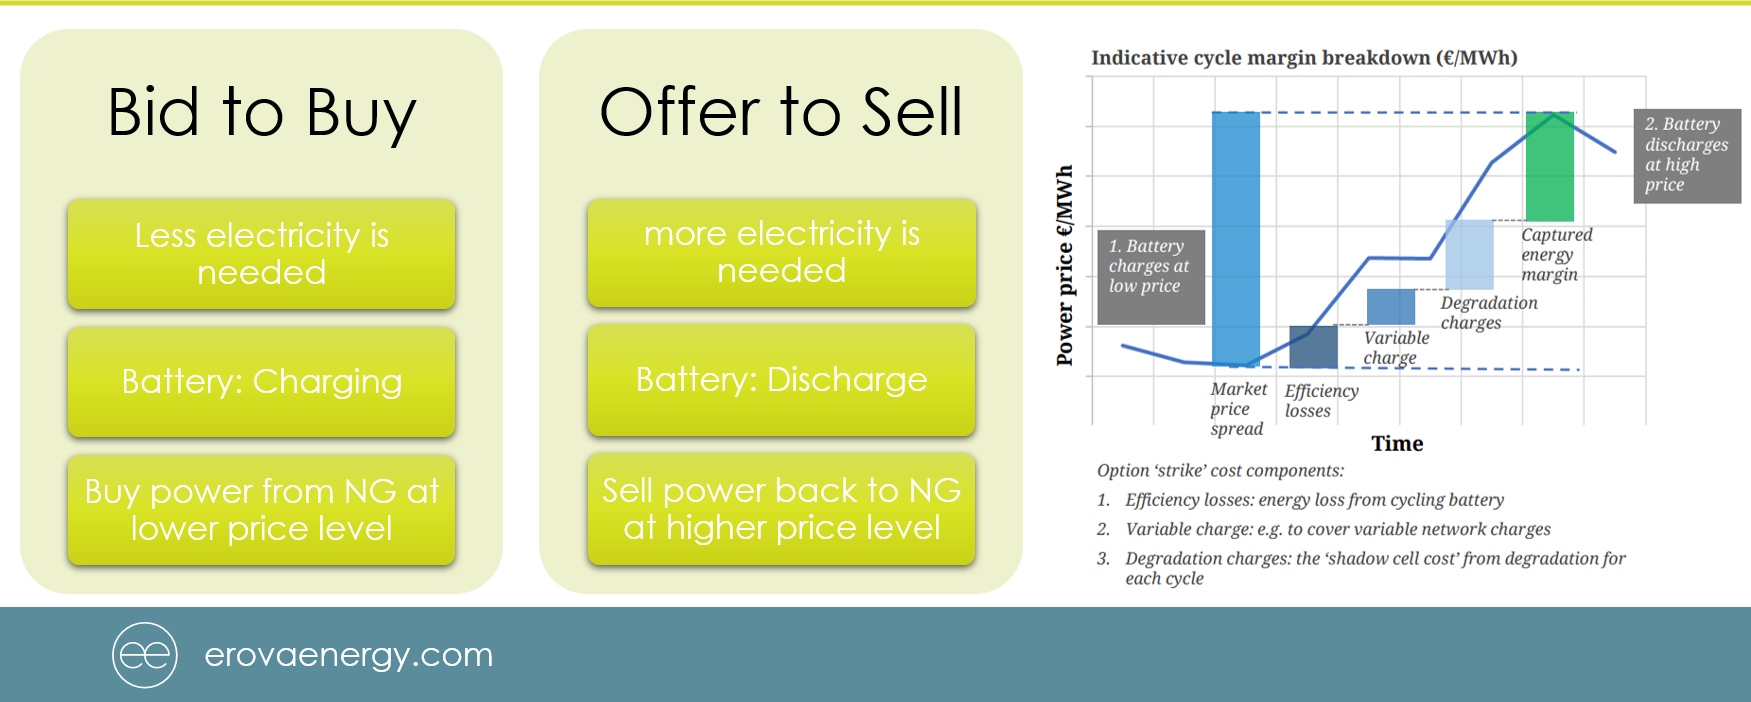
    The Balancing Mechanism is manually dispatched by the ESO Control Room – providers submit Bids (to buy from the BM) and Offers (to sell to the BM) along with the related volumes, and only deliver (and are paid) when selected.

    When more electricity is needed, National Grid accepts an offer from a provider. The battery is discharged and sends the power to the grid. If less electricity is needed, National Grid accepts a bid. The battery charges from the grid and removes electricity from the system.

    A battery is effectively an option to move power from lower price periods (charging) to higher price periods (discharging). In another word, batteries can buy power from National Grid at lower price levels and sell power back to National Grid at higher price levels. Therefore, the higher the volatility, the higher the spread between low price and high price, creating more opportunity for a battery to generate positive revenue.

    With high market volatility comes forecast risks, which need to be actively managed. Erova manages this risk using internal AI forecast models, second-by-second data monitoring and provides 24/7 trading.


    Batteries in the day-ahead market

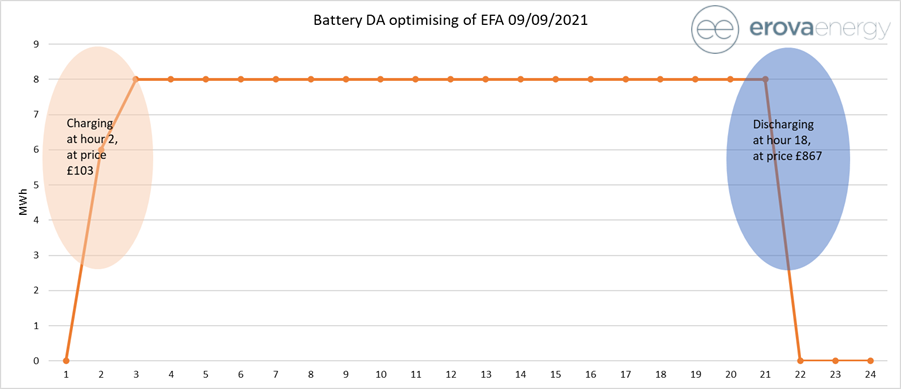
    There is another way to manage the risk and lock in revenue at day-ahead stage. The day-ahead wholesale market is relatively liquid. It comes with lower risk, but also lower volatility, which is good for creating a base layer of revenue. Utilising Erova’s systems, models and trader led optimisation, the high price period vs the low price period is straightforward to forecast.


    Batteries in the dynamic containment market

    A battery operator needs to co-optimise these wholesale and balancing revenues with other value streams, such as Dynamic Containment. Dynamic Containment is a new, fast-acting, dynamic post-fault frequency response service. It is the first of National Grid ESO’s (NGESO) new suite of frequency products, designed to stabilise grid frequency in case of large generation or consumption drop-outs.

    This response to the drop-outs needs to be available and respond quickly when called. Batteries speed and flexibility make them particularly well-suited to the task. The National Grid buys baseload power from a battery at the day-ahead stage as a preparation with previous prices running at £17/MW/hour giving a daily revenue of £408/MW (£17*24hr).

    This example shows revenue locked at £764/MW on a tight day.


    Open Energi and Erova

    Erova works alongside Open Energi on operating batteries across all value streams, we deliver full end-to-end optimisation through Trader Lead Automation. We help to decide which market is best to optimise revenue.

    For example, on a comfortable day, with low day-ahead auction prices, a battery should stay in a Dynamic Containment contract and get paid at £408/MW as main revenue. This allows for Balancing Mechanism bids (to charge), while stacking some Balancing Mechanism revenue when called.

    On a tight day, when the day-ahead auction is high enough, a battery should withdraw from a Dynamic Containment contract and move to day-ahead trading, getting paid over £408/MW along with the addition of intra-day and Balancing Mechanism participation on top.


    Future opportunity

    The latest developments from the National Grid ESO changes the Dynamic Containment contract from 24 hours to EFA Blocks since 15th September. We now see different clearing prices at varying EFA periods. This gives us more accurate market price signals, which increases market participation and, as the market develops and grows, increases liquidity.

    Erova has been co-optimising across Dynamic Containment and the Balancing Mechanism for some time and can be seen on external leader boards as delivering maximum value across all providers. Going forward our future optimisation process will now include more dynamic participation across DC + DAH + BM with Erova being one of the few Battery aggregators with both N2EX and EPEX market access for multi-DAH price optimisations.


    Click here to learn more about Erova’s Storage Optimisation Services or contact one of the Origination team.


  • Corporate PPAs and RESS

    Corporate PPAs and RESS

    Reverse RESS Auctions

    Kim Scullion, January 2021


    Overview

    Ireland has decided that the most efficient and least expensive way to achieve our Renewable Energy targets is to hold a number of auctions now known as the RESS auction.  Within this process the least expensive renewable projects will be successful whilst the most expensive will fall away or look for alternative merchant structures.

    Q: Should RESS auctions therefore not be for the full volume required to meet Ireland’s renewable energy target as they are designed to be the most efficient and cost-effective way of meeting these targets?

    Or put another way:

    Q: Is the RESS auction not the most efficient way for both corporates and generators to also meet the 15% renewable target expected to be met by Corporate PPAs? (“CPPA”)

    Corporates want to source their power from renewable sources, but it needs to be made easier for them to do this. They need to be incentivised and encouraged to participate in Ireland’s existing mechanisms that we are using to build out the renewable energy we require.


    Reverse auction for corporates

    Any projects which are ready to be built will bid into the RESS auction and the most expensive projects will not be successful.

    Q: Does this then not imply that the 15% that corporates are expected to contract with will be more expensive projects than the RESS projects?
    Q: Are corporates likely to sign a PPA for renewable generation that is more expensive than PSO generation?
    Q: Could corporates be encouraged to enter the auctions (in an opposite direction to the generators) by allowing them to take the cheapest new renewable generation to meet their demand?

    Corporates could bid their strike price offer into the auction (they would then essentially take up the least expensive volume first). Their contract could then be with the PSO so there is no counterparty risk for the generator or the corporate. If successful their Reverse RESS CFD would hedge some of the PSO exposure to the strike prices and thus reduce the volume of Feed in Premium (FIP) covered by the RESS contracts (so if there was 15% demand from corporates and they took 15% of the auction, RESS would only be supporting the remaining 85% as is expected, if corporates take up more it reduces the support required from the PSO).


    RESS support paid directly to the generator

    Reverse auctions would be another reason that a generator should not be required to enter into a PPA with a licenced supplier for RESS. Support should go directly to the generator. The generator could then have a CFD with RESS (PSO) for the RESS Strike Price and the corporate could have a (corresponding) Reverse RESS CFD with the PSO.

    There is no reason in the SEM market why a RESS generator should have to enter into a PPA with a licenced supplier to obtain RESS support. A generator can register directly in the SEM (it does not need a supplier to access the market). If it has a RESS CFD then it will obtain the RESS Strike Price less the DAM Price. To get the DAM Price it could enter into a balancing contract with a trader like Erova.

    A corporate would then be free to choose its supplier in the market and maintain the ability to change suppliers in the future (for its onsite demand) as it is free to do so now. If a generator receives the PSO support directly, you then will not have two different suppliers, i.e., one holding a PPA with the RESS generator and a different supplier supplying the corporate’s (corporate who has the Reverse RESS CFD) onsite demand.

    The SEM is designed that all generation must sell into the market and all demand has to buy from the market. So even under the current design where a RESS 1 generator has to enter into a PPA with a licensed supplier, the supplier has to “sell” this generation into the market and then buy it back if it needs these MWhs to meet its demand i.e., the RESS generator’s MWhs are not netted from the supplier’s (supplier who holds the RESS PPA) physical demand.

    There is no reason why a RESS generator should have to enter into a PPA with a licensed supplier in order to get RESS support.


    Paying for renewable generation through a PSO Levy

    If corporates want to base themselves in Ireland and do not contract directly with renewable generation or through a Reverse RESS CFD scheme they will be subject to the PSO levy like all customers in Ireland.

    If corporates want to say they are 100% powered by new renewable generation, they could contract for this through a Reverse RESS CFD. Potentially, they could then be given an exemption from paying the PSO levy for the volume they have a Reverse RESS CFD in place for.

    This saving could then be weighed up when choosing to bid into the Reverse RESS CFD auction (i.e., forecast of the cost of the PSO levy on their demand for the next 15 years vs fixing a Reverse RESS CFD which exempts them from this cost, as well as hedges the variable cost of their electricity supply bill).

    A: Corporates that have a Reverse RESS CFD for some of their demand volume could get an exemption from paying the PSO levy on this volume.


    Reverse auction for anyone

    Technically anyone could be allowed to bid in on the reverse side of the RESS auction (subject to certain collateral or qualification requirements). If you would like to buy additional renewable generation by entering into a Reverse RESS CFD you could.

    This could create demand from corporates or even a secondary RESS market. So, for example, a trader or supplier could buy a Reverse RESS CFD and sell on to a corporate.

    Demand would still have to come from a corporate as they may only want this type of contract if they knew they would have to pay a higher PSO levy to cover 100% of their generation or a higher levy if they do not secure renewable generation themselves through a Reverse RESS CFD.

    Reverse auctions could be run at the same time as the RESS auction and bids to buy could be matched with offers to sell or they could be run separately to RESS auctions, after the event.

    Reverse RESS CFDs could also be for different terms. Just because the RESS contract is for 15 years does not mean the Reverse RESS CFD would have to be for the same length of time.


    Potential barriers that may delay uptake of CPPAs

    Some of the barriers for the delay in uptake of CPPAs include price, term, size, and traceability.

    Price

    In Ireland, a CPPA with a renewable generator is likely to cost in the range of €55/MWh and €70/MWh depending on the technology and competitive nature of the project. This compares to wholesale prices for “brown power” currently in the €40’s/MWh.

    A: A RESS auction for Ireland’s full renewable target (i.e., including the expected 15% from corporate demand) would ensure the corporates pay the cheapest price for new renewable generation.


    Term

    A new renewable generator will need a fixed price for a long term, so probably 8, 10 or even 15 years in order to satisfy their lender’s requirements for the project debt. Most small or medium sized corporates will not have board approval to sign any type of contract past 5 years.

    Also, many corporates will not want to fix a price for a long term if they think their competitors are not fixing a price too. This is because, should prices subsequently fall and their competitors who did not fix were then paying less for their power than themselves this would then allow their competitors to decrease the price they were charging their customers (corporates pass through their costs of power to their customers). A year or two of this could put the corporate that had fixed a higher power price out of business.  (Although this could be offset by the fact that any corporates picking up cheaper wholesale power could be paying a higher PSO levy if they have not secured a long term Reverse RESS CFD).

    Although some large corporates will be in a position to enter into long term deals to enable a renewable project to be financed this will be limited to a small number of very large players.

    A: Reverse auctions can be for any term with any volume contracted to a corporate contributing to reducing the exposure to Feed in Premium (FIP) on the other side of the RESS auctions (i.e., reducing the PSO).


    Size

    Renewable energy projects vary in size, but most commercial projects are above 5MW. A project this size produces a lot of electricity over the year, the number of individual corporates of this size are limited. Aggregation of corporates would be great but the ease and speed at which this could happen to get a project over the line is not to be underestimated.

    A: Reverse auctions could be for any volume. RESS generators will have their RESS contract for their full volume for 15 years but corporates could secure a Reverse RESS CFD for any volume for any term. The Reverse CFDs could be with the PSO and not the counterparty.


    Traceability

    As the SEM is not a physical market any corporate who now signs a CPPA with a generator is still not “physically” getting the generation from this project. All generation must be sold into the SEM and all demand must be purchased form it. Therefore, there is no reason why a corporate signing a Reverse RESS CFD with the PSO would prove anything less in terms of their demand being met with new renewable generation than a CPPA does now in SEM.


    Conclusion

    It is widely publicized that data centres will increase Irelands demand for power over the next few years. This increase in power demand increases our RESS target and increases the risk that we will miss our targets for meeting a percentage of this higher demand figure with renewable energy.

    Large energy users need to be encouraged to source their power from renewable power. Or at least some of the barriers for not entering into a CPPA on both sides (generator and corporate) need to be addressed by the government if they are relying on a portion of their RESS target being met by CPPAs.

    If CPPAs do not deliver as expected, Ireland will not meet their targets and will be subject to EU fines. Corporates will not pay for these fines, Ireland will.

    A government backed and run Reverse RESS auction could help reduce the barriers to entry for all size corporates, reduce the country’s PSO burden and make sure Ireland meets its RESS targets.

    To discuss further please contact trading@erovaenergy.ie

  • I-SEM in Review: Week 36

    I-SEM in Review: Week 36

    Market Summary
    • Total Wind production was 1.54GW (All Ireland) on average throughout the week, 1% up from the previous week
    • Day Ahead price down 22% from the previous week (Average 37.66, Max 60.94 and Min 1.87)
    • NIV positive (short) for 200 times and negative (long) for 136 times
    • There are 12 negative SIPs throughout the week (Average 38.84, Max 367.69 and Min -25.85)
    • Average Gas price (NBP front month) down 15% from the previous week. Its Ave 22.16, Max 25.10 and Min 19.50
    Overview of Market Prices
    Unit
    Average
    Max
    Min
     Positive
    Negative
     Demand
    GWh 3.93 4.94 2.67
     Wind
    GWh 1.54 3.20 0.04
     NIV
    MWh 3.10 67.70 -47.45 200 136
     DA
    EUR/MWh 37.66 60.94 1.87 336 –
     GAS
    GBP/thp 22.16 25.10 19.50
     SIP
    EUR/MWh 38.84 367.69 -25.85 324 12


  • I-SEM in Review: Week 35

    I-SEM in Review: Week 35

    Market Summary
    • Wind production was up 14% against the previous week producing 1.5GW (All Ireland).
    • Day Ahead price up 6% from the previous week (Average 48.24, Max 120.00 and Min 0), with the first 3 days remaining high whilst second half dropped as participants saw high wind output.
    • NIV positive (short) for 179 times and negative (long) for 157 times.
    • Negative SIP accounted for 50 pricing event throughout the week. (Average 31.20, Max 312.83 and Min -221.26).
    • Average Gas price (NBP front month) dropped down 2.69% from the week 34. Its Ave 26.36, Max 27.75 and Min 25.25.
    Overview of Market Prices
    Unit
    Average
    Max
    Min
     Positive
    Negative
     Demand
    GWh 3.89 4.85 2.61
     Wind
    GWh 1.50 2.97 0.21
     NIV
    MWh -2.00 54.01 -82.84 179 157
     DA
    EUR/MWh 48.24 120.00 – 336 –
     GAS
    GBP/thp 26.36 27.75 25.25
     SIP
    EUR/MWh 31.20 312.83 -221.26 286 50
  • I-SEM in Review: Week 20

    Market Summary
    • Wind production returned this week, up 55% against the previous week with 1.08GW (All Ireland).
    • Day Ahead prices were down 12% from week 19. (Average 45.81, Max 71.19 and Min 29.12)
    • NIV positive (short) for 184 times and negative (long) for 152 times.
    • Negative SIP accounted for 20 pricing event throughout the week. (Average 44.88, Max 482.09 and Min -112.42).
    • Average Gas price (NBP front month) dropped down 6% from the week 19. Its Ave 30.90, Max 32.43 and Min 29.85.
    Overview of Market Prices
    Unit
    Average
    Max
    Min
     Positive
    Negative
     Demand
    GWh 3.93 4.80 2.65
     Wind
    GWh 1.08 2.60 0.21
     NIV
    MWh -0.78 48.86 -85.66 184 152
     DA
    EUR/MWh 45.81 71.19 29.12 336 –
     GAS
    GBP/thp 30.90 32.43 29.85
     SIP
    EUR/MWh 44.88 482.09 -112.42 318 18
  • I-SEM in Review: Week 19

    I-SEM in Review: Week 19

    Market Summary
    • Wind produced 0.70GW (All Ireland) on average throughout the week, 13% down from the week 18.
    • Day Ahead price up 5% from the week 18. (Average €51.82/MWh, Max €93.20/Mwh and Min €27.83/MWh)
    • NIV positive (short) for 226 times and negative (long) for 110 times.
    • Negative SIP accounted for 1 block throughout the week with an average price of €55.40/Mwh (Max €453.75/MWh and Min -€12.25/MWh).
    • Average Gas price (NBP front month) dropped down 2% from the week 18 with an average price of  33.00 p/th (Max 34.10p and Min 31.90p).


    Overview of Market Prices
    Unit
    Average
    Max
    Min
     Positive
    Negative
     Demand
    GWh 4.08 5.15 2.87
     Wind
    GWh 0.70 2.31 0.04
     NIV
    MWh 5.97 63.42 -46.55 226 110
     DA
    EUR/MWh 51.82 93.20 27.83 336 –
     GAS
    GBP/thp 33.00 34.10 31.90
     SIP
    EUR/MWh 55.40 453.75 -12.25 355 1


  • I-SEM in Review: Week 16

    Market Summary
    • On average wind produced 1.19GW across the week, 21% down from week 15.
    • Although wind output was down we didn’t see an uplift in power prices with the Day Ahead price down 9% from week 15. (Average €50.62/MWh, Max €79.01/MWh and Min -€0.10/MWh)
    • NIV positive (short) for 162 times and negative (long) for 174 times.
    • Negative SIP accounted for 7 periods throughout the week (Average €55.84/MWh, Max €367.26/MWh and Min -€144.38/MWh).
    • Average Gas price (NBP front month) gained 10% from week 15 (Average 35.25 p/th, Max 37.25 p/th and Min 34.45 p/th).


    Overview of Market Prices
    Unit
    Average
    Max
    Min
     Positive
    Negative
     Demand
    GWh 4.20 5.30 2.87
     Wind
    GWh 1.19 3.87 0.04
     NIV
    MWh -0.27 67.27 -57.77 162 174
     DA
    EUR/MWh 50.62 79.01 -0.10 332 4
     GAS
    GBP/thp 35.25 37.25 34.45
     SIP
    EUR/MWh 55.84 367.26 -144.38 329 7
  • I-SEM in Review: Week 15

    I-SEM in Review: Week 15


    Market Summary
    • Wind produced 1.50GW  on average throughout the week, 14% up from the week 14.
    • Day Ahead price was up 15% from the week 14 with an average price of €55.69/MWh(Max €109.89, Min €0)
    • NIV positive (short) for 193 times and negative (long) for 143 times.
    • SIP out tuned at €51.16/MWh (Max €218.42, Min -€203.57).
    • Average Gas price (NBP front month) gained a further 4% from the week 13, its avg 38.71 p/th (Max 41.55 p/th, Min 37.70 p/th).


    Overview of Market Prices
    Unit
    Average
    Max
    Min
     Positive
    Negative
     Demand
    GWh 4.28 5.14 3.00
     Wind
    GWh 1.50 3.37 0.17
     NIV
    MWh 2.41 75.20 -54.16 193 143
     DA
    EUR/MWh 55.69 109.89 – 336 –
     GAS
    GBP/thp 38.71 41.55 37.70
     SIP
    EUR/MWh 51.16 218.42 -203.57 315 21
  • I-SEM in Review: Week 14


    Market Summary
    • Wind production returned this week, up by 166% with an average output of 1.32GW.
    • Day Ahead power prices fell 12% from week 13 with an average price of €48.52/MWh (Max €45.80, Min €49.31).
    • NIV positive (short) for 205 times and negative (long) for 131 times.
    • System prices averaged out at €62.97/MWh (vs €59.56 in the previous week) with a spread of -€37.97 to €342.77.
    • Average Gas price (NBP front month) started to gain with a 4% increase from last week (Avg 37.17 p/th, Max 41.50 p/th, Min 32.13 p/th).


    Overview of Market Prices
    Unit
    Average
    Max
    Min
     Positive
    Negative
     Demand
    GWh 4.39 5.39 3.10
     Wind
    GWh 1.32 3.36 0.24
     NIV
    MWh 2.62 45.80 -49.31 205 131
     DA
    EUR/MWh 48.52 81.42 30.39 336 –
     GAS
    GBP/thp 37.17 41.50 32.13
     SIP
    EUR/MWh 62.97 342.77 -37.97 335 1